Before you bite into that cheese-oozing, crust-crunching $5 slice of pizza, there’s something you should know—and it has nothing to do with calorie counts or whether to use a fork. It has to do with the price. In 1971, that delicious slice might have cost you, its consumer, about 25 cents.
Now granted, 50 years is a long time, and $5 a slice might sound reasonable to you today. It might even sound cheap. After all, over your working career, your income has likely increased as well, to the point where plunking down $5 for a slice of pizza—or for pretty much anything—feels normal and natural.
Just know, though, that that slice is costing you 1,900% above what your parents paid 50 years ago. That’s a lot more than the slice would cost if its price rose at the same pace posted by the Consumer Price Index—the CPI—during that time period, which was 600%. Indeed, if the slice’s price had risen by “only” 600%, today it would cost you … $1.75.
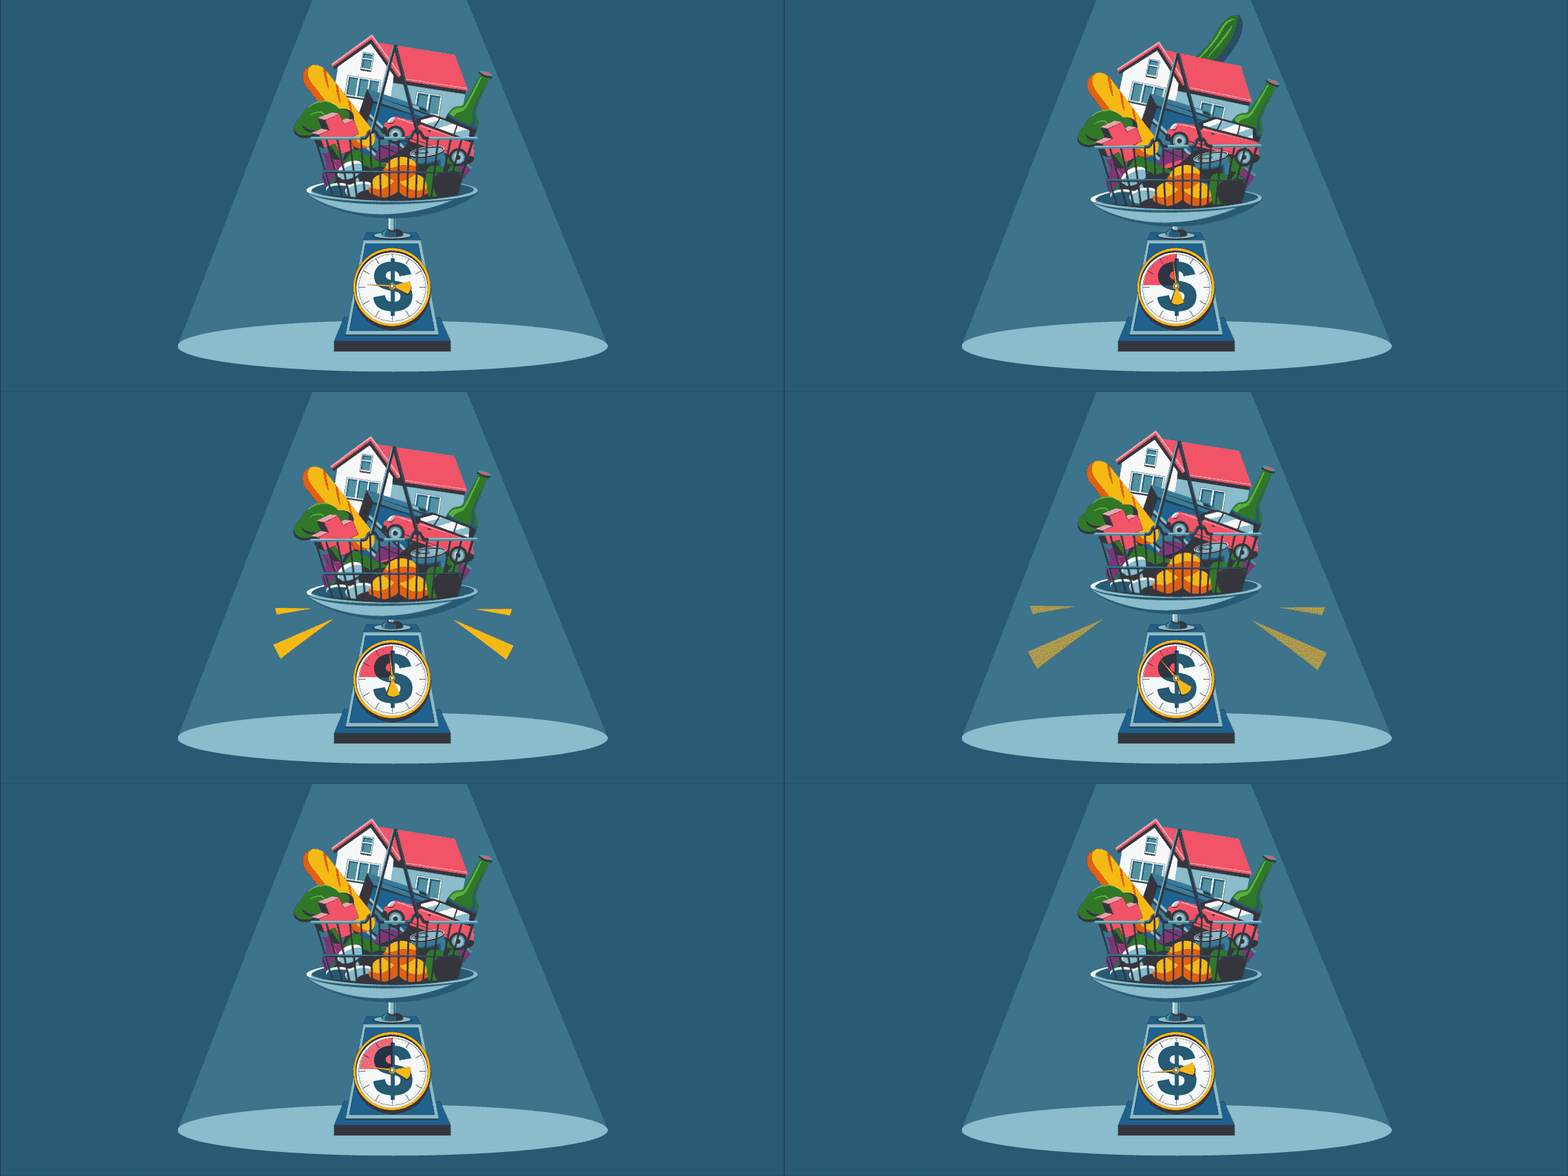
The CPI measures how fast the prices of household goods and services are rising, which is called inflation, or falling, which is called deflation. Both policymakers and the general public want to be sure that as economic activity grows, inflation is contained at a reasonable level and that it doesn’t cause affordability issues down the line.
If the CPI were to show prices rising too far, too fast or for too long, the Federal Reserve, which is the nation’s central bank, might feel compelled to raise interest rates to slow the economy. That could affect the value of your investments as well as your monthly interest payments on some home, automobile and credit card loans.
Now that you have a general idea of what the CPI does and why people are talking about it, let’s look in more detail at how it is created and how it affects you.
Where Does the CPI Come From?
The U.S. Department of Labor produces the CPI. To do so, it collects price data every month from thousands of purveyors, covering about 80,000 typical consumer goods and services, in urban areas nationwide that together represent some 93% of the population.
The increase or decrease in the prices of these goods and services from both one month and one year earlier are then reported to the public a few weeks later. For example, in June 2021, the Department of Labor reported on how much prices had moved in May 2021 from both April 2021 and May 2020.
What Does the CPI Measure?
The Department of Labor breaks down spending data into geographic regions, socioeconomic strata and many other ways. For example, it recalculates the index by stripping out the cost of food and energy—the most volatile components of the CPI—to get a clearer picture of “core” price movements.
For similar reasons, it also subdivides the data into eight major buckets—as well as numerous smaller ones within these broader classifications. The major buckets are:
- Food and beverages
- Housing
- Apparel
- Transportation
- Medical care
- Recreation
- Education and communication
- Other goods and services
What Does the CPI Mean for My Budget?
While the CPI gets most of its press as an inflation gauge, the index is not just a tool the government uses to measure inflation or deflation. There are many other real-world applications, including:
- Social Security benefits: The government relies on the CPI when calculating cost-of-living changes to Social Security benefits.
- Retirement contributions: Similarly, the government uses CPI to determine the amount of money you can contribute to a tax-advantaged retirement account in any given year.
- Salaries: Sometimes, private employers use the inflation gauge to help decide how much they should raise wages.
- Rent: Landlords may use the CPI to determine how much to raise your rent.
The CPI also helps individuals budget and spend properly, as it’s an easy way to get a look at recent pricing trends for a good or service you might want to purchase sometime soon. If you see that the price of a used car is skyrocketing, for example, you might want to buy a car as soon as possible, before prices get even worse. But if the acceleration in prices seems like it may not stick, that might encourage you to delay the timing of the purchase.
Investors focused on interest rates, meanwhile, can use the data to help them decide which asset classes might benefit—and which might be hurt—when the prices of consumer goods and services are rising or falling rapidly.
Andy Sobel is a freelance writer and editor. He has held senior editing positions in The Wall Street Journal’s New York and Brussels newsrooms and was managing editor of American Banker. A graduate of the University of Missouri and Union College, he now lives in Nashville, TN.

